Provide reliable assessments of the spatial and vertical distributions of soil carbon stocks in permafrost region soils
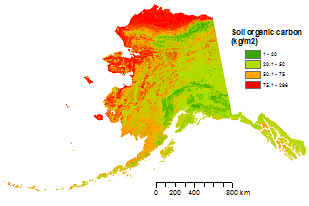
Under this objective, we are creating high-resolution maps of the spatial and vertical distributions of carbon (C) stocks in permafrost-region soils (Figure 1). To produce these maps we are coupling (1) detailed knowledge of the relationships between soil-forming factors and soil C distributions with (2) high-resolution mapping of the spatial variability of soil, environmental, geomorphic, and vegetation properties that best predict the effects of these factors on soil C stocks. Our soil organic carbon (SOC) maps and assessment products will be used as benchmarks for Earth system and regional-scale models to validate and calibrate model simulations of baseline SOC stocks. Our products will also provide the quantitative basis for representing the potential susceptibility to mineralization of organic C stored in permafrost-region soils under Objective 2 of our SFA.
Geospatial analysis and C assessments
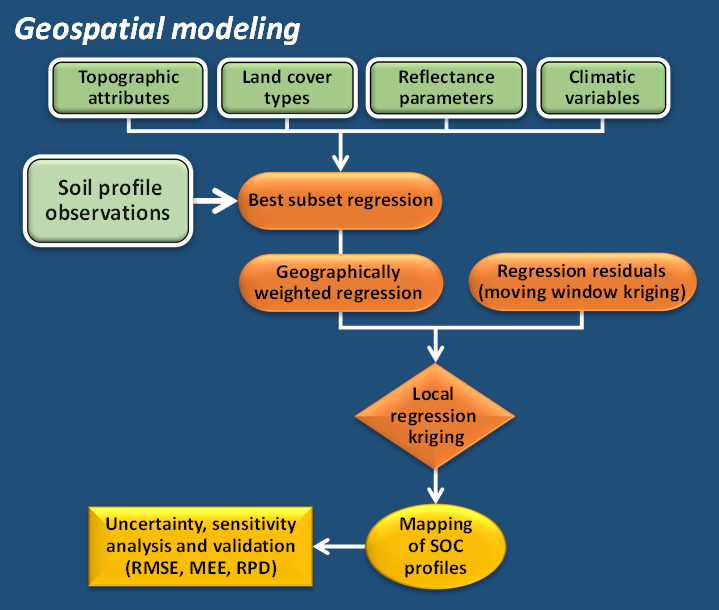
We use geospatial modeling to predict the spatial and vertical distributions of SOC stocks. By using this approach, the spatial variability of SOC is analyzed with respect to spatially referenced predictive factors (soil properties, climate, organisms, relief, parent material, age, and spatial coordinates). These factors are then used to project the spatial distribution of SOC stocks at the regional scale. The maps generated by this approach adequately describe variations in the spatial distribution of SOC, with low prediction errors, because the relationships between SOC and environmental variables are taken into account by the spatial modeling. Several geospatial modeling techniques can be used to predict and map the horizontal and vertical distributions of soil properties. We are using regression kriging, which couples the geographically weighted relationships between SOC and environmental parameters with the spatial autocorrelation in regression residuals for SOC to predict and map SOC profile distributions (Figure 2). The results are validated against additional observations. We then use geospatial statistics to provide uncertainty estimates and to perform sensitivity analyses, which improve understanding of the role and importance of different environmental drivers.
Reducing uncertainties
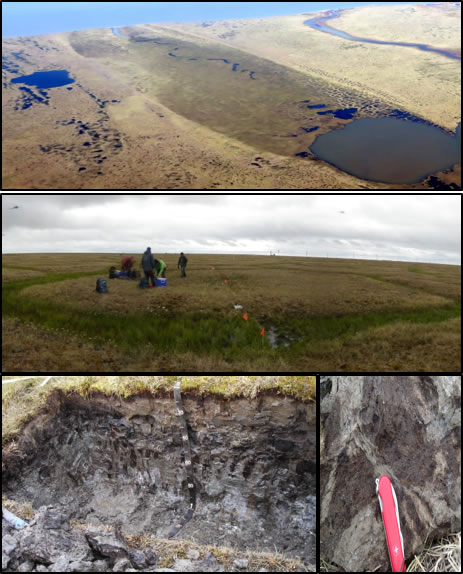
Current estimates of SOC stocks for the northern circumpolar permafrost region have exposed several sources of uncertainty including (1) the variability of organic C stocks in areas dominated by cryoturbated soils and in lowlands, (2) the limited amount of data available for deep C stocks, and (3) the uneven distribution of samples across the region. Currently, we are investigating the spatial and vertical distributions of SOC stocks in patterned ground (particularly ice-wedge polygons) as an initial step in reducing the uncertainty for cryoturbated soils. We are also adding to the limited measurements of C stored in deep permafrost horizons, particularly for the windblown, ice-rich Yedoma deposits.